These actors hold the gridded data and provide the various methods needed for visualizing the features.
Note
For all actors that visualize gridded data please note the following:
- The “variables” of the actors can be synchronized with the global time and ensemble settings but don’t have to be synchronized (e.g. if different ensemble members shall be compared).
- Availability of ensemble functionality depends on the data pipeline (if connected to an ensemble dataset, the pipeline can provide the data of different ensemble members or compute statistical quantities including ensemble mean and probabilities).
How to...
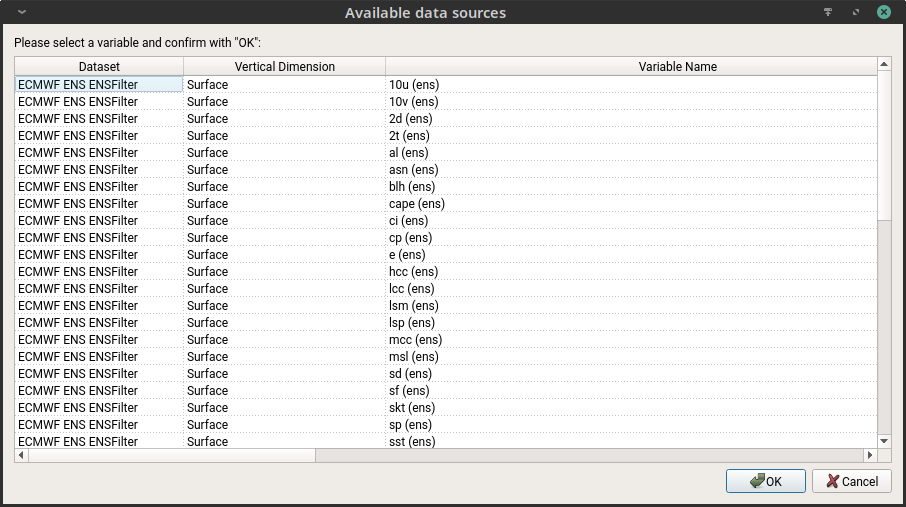
...add variables?
For all these actors, there exists an add new variable option, on clicking the execute, the list of variables available in the data loaded with the data pipeline is displayed and the user can choose the variable that needs to be added.
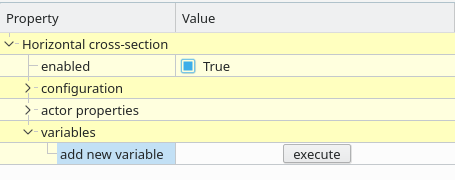
The user needs to repeat this step to add multiple variables or even the same variable multiple times.Also, once a variable has been added, it has options so that it can be removed or changed.
...get information about the variable's data?
It is possible to get some statistics about the data of a given variable.
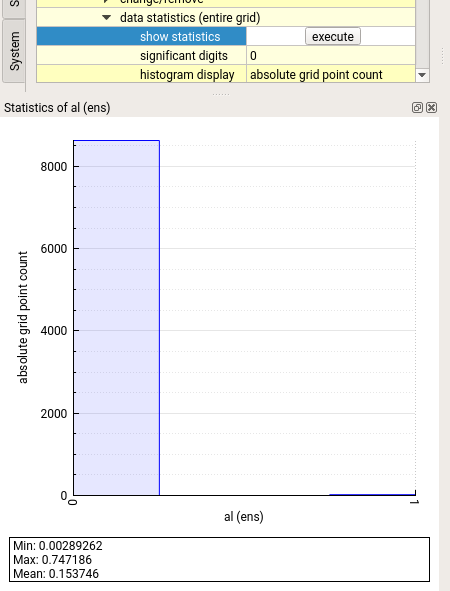
Also, it is possible to export the data to an external file for debugging purposes.

...smoothen the data?
Met.3D provides options to smoothen the data.
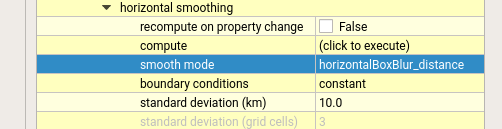
Currently horizontal smoothing is possible using either distance based or grid cell based modes.
We recommend to use the smooth mode "horizontalBoxBlur_distance" with "symmetric" boundary conditions.
...visualize ensemble data?
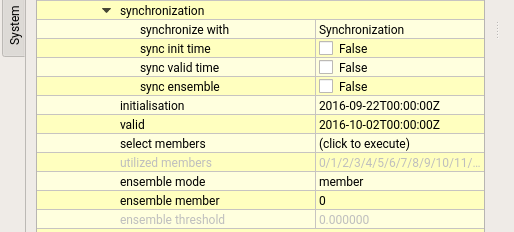
Met.3D supports ensemble visualization. Each variable by default is synchronized to temporal extents and ensemble size based on the data loaded using the data pipeline.By, turning off the ensemble synchronization, the user can choose the members and the ensemble mode. Currently individual member or ensemble mean, standard deviation, min, max, max-min, above or below a threshold are supported.